Project 4 - Web Crawler
Due by 11:59pm on December 8, 2025
ReminderFor all projects, BEFORE you start coding, READ THROUGH THE ENTIRE SPECIFICATION and think through at a high level how your full solution will look. Then start coding.
Objectives
- Learn web basics (HTML, web protocols)
- Learn how to use the Requests, BeautifulSoup, and matplotlib libraries
- Understand basic plotting
Introduction
In this project you will build a simple web crawler that can load web pages, follow links on those pages, and extract data from the pages loaded. This is the final project of the class and by now you should be able to take the specifications for a problem and turn that into a working program.
As part of this project you’ll learn about how the web works, some etiquette and protocols when crawling web pages, and how to programmatically read the pages you load and extract data from them. This project consists of three parts:
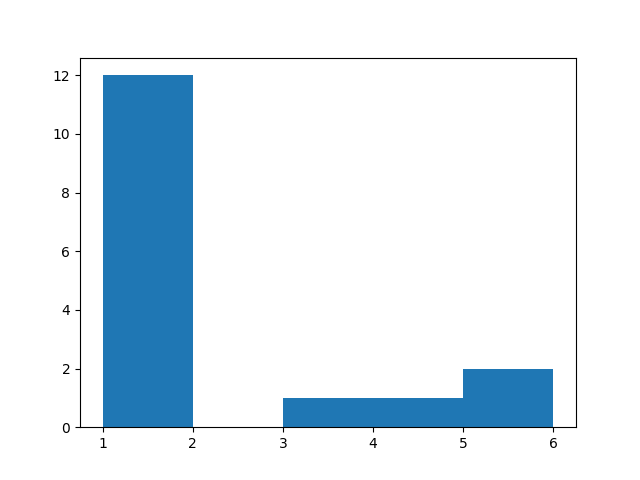
- Link counting - Starting at an initial page created for the class, you’ll find and count all the links on the page and only load the pages that are on the same domain as the original page, and that you haven’t loaded previously. On each page you load you will repeat the same process of finding and loading links until you’ve found every link on every allowed page. During that time your program will record how many times it sees each webpage. At the end, you’ll produce a histogram showing the number of pages that have been seen once, twice, etc. This information will be saved to output files.
- Data Extraction - Given a URL with tabular data on the web page, you will need to extract that data, plot it, and then write it to output files.
- Image manipulation - Download all the images on a specified page and then run your image manipulation program from Project 1 on them to produce a new output images.
In the previous projects, we’ve walked you through each of the individual steps to accomplish the task at hand. In this project, there will be a lot less of that. We’ll tell you what needs to be done and possibly give you some specifications of elements to use, but generally you’ll be on your own to design the exact implementation and steps to take to achieve the outcome.
Program Specification
For this assignment, your program will take command line arguments with the following signatures:
-c <url> <output filename 1> <output filename 2> # For the count links function
-p <url> <output filename 1> <output filename 2> # For the extract and plot table function
-i <url> <output file prefix> <filter to run> # For the image downloading and processing function
Examples:
-c http://cs111.byu.edu/Project/project04/assets/page1.html project4plot.png project4data.csv
-p http://cs111.byu.edu/Project/project04/assets/data.html data.png data.csv
-i http://cs111.byu.edu/Project/project04/assets/images.html grey_ -g
-i http://cs111.byu.edu/Project/project04/assets/images.html sepia_ -s
Note: the above command line arguments are valid and can be used for manually testing your code
To complete this assignment, implement the following functionality:
- Command Validation:
- Using the following criteria, your program should always validate the
system arguments passed in from the command line before running anything
else:
- Command line arguments should always be at least 5 items long, including your program filename. You may disallow or ignore any extra arguments
- Command line arguments should always start with a valid flag (
-c,-p, or-i) - If the flag is
-i, the<filter to run>must also be a valid flag (-s(sepia),-g(grayscale),-f(vertical flip), or-m(horizontal flip/mirror))
- Using the following criteria, your program should always validate the
system arguments passed in from the command line before running anything
else:
- Counting Links:
- If the flag from the command line is
-c, your program should do the following:- Set up a RequestGuard object for the domain of the url passed into your program
- Scrape (using requests and BeautifulSoup) the url passed into your
program, finding all links on the page. Keep track of how many times you
see each link. Visit any web pages from that page which you are allowed
to visit (based on RequestGuard) and repeat this step. Do not visit or
scrape the same link multiple times, but still count them.
- Links you will find on webpages will appear in multiple forms, but must
all be converted to full links without fragments (#) before they can
be counted (ex.
https://<domain>/<page>)
- Links you will find on webpages will appear in multiple forms, but must
all be converted to full links without fragments (#) before they can
be counted (ex.
- Graph a histogram showing how many links appeared once, twice, thrice,
etc. using the values of your counting dictionary. Save the histogram as
<output filename 1>. Refer to the test_files for a key. You will have to specify bin values when graphing. - Write the same data to a csv file called
<output filename 2>. Refer to the test_files for a key. Write data in the following form:
- If the flag from the command line is
<bin value 1>,<count 1>
<bin value 2>,<count 2>
...
- Plotting Data:
- If the flag from the command line is
-p, your program should do the following:- Load the page from the url passed in on the command line. Locate the
table with the id “CS111-Project4b” and extract its data (using
BeautifulSoup tags).
- The first column of any table will be the x-values, and all following columns will be y-values. For example, a table with 5 columns will have 4 different y-values for each x value since all y-values in a row share the same x-value. Your program must support there being anywhere from 2 to 5 columns.
- Graph the data (using a matplotlib plot) all on the same plot going from
the leftmost y-column to the rightmost one. Give the lines the following
colors in order: blue, green, red, then black. If there are not 4 lines,
only use as many colors as you need. Save the plot as
<output filename 1>.- Make sure the values that you are graphing are floats.
- Write the data to a csv using the filename
<output filename 2>from the command line. Write the data row by row as it appeared on the website, but with commas between values rather than spaces. Refer to the test_files folder for the key.
- Load the page from the url passed in on the command line. Locate the
table with the id “CS111-Project4b” and extract its data (using
BeautifulSoup tags).
- If the flag from the command line is
<xval>,<yval1>,<yval2>,<yval3>,<yval4>
<xval>,<yval1>,<yval2>,<yval3>,<yval4>
<xval>,<yval1>,<yval2>,<yval3>,<yval4>
- Modifying Images:
- If the flag from the command line is
-i, your program should do the following:- Load the page from the url passed in on the command line and find all
images (
tags) on the page. Download each image, with the image filename being the href of the image.
- Depending on which image processing flag was passed in (the last command
line argument), apply the given filter from Project 1 to each image you
downloaded and then save each image with the same name as it had before
but with
<output file prefix>added to the front of the filename.
- Load the page from the url passed in on the command line and find all
images (
- If the flag from the command line is
Note: make sure that you validate the image filter as part of your argument validation (step 1).
Test Your Code
You can test your code locally by running: (Mac and Linux)
python3 -m pytest(Windows)
python -m pytestOr to run tests individually use the following commands:
python -m pytest test_webcrawler.py::test_invalid_arguments
python -m pytest test_webcrawler.py::test_valid_arguments
python -m pytest test_webcrawler.py::test_request_guard
python -m pytest test_webcrawler.py::test_count_links
python -m pytest test_webcrawler.py::test_plot_data_two_column
python -m pytest test_webcrawler.py::test_modify_images_grayscale
Example Input and Output
python3 webcrawler.py -c https://cs111.byu.edu/Projects/project04/assets/page1.html count_links.png count_links.csv| count_links.png | count_links.csv |
|---|---|
|
|
|
python3 webcrawler.py -p https://cs111.byu.edu/Projects/project04/assets/data.html data.png data.csv
python3 webcrawler.py -i https://cs111.byu.edu/Projects/project04/assets/images.html grey_ -g
Starter Files
Download project04.zip. Inside the archive, you will find the starter and test files for this project.
Part 1 - Setup
Task 1 - Install the needed libraries
In order for this project to work, you will need three external libraries that are not part of the default python installation: Requests, Beautiful Soup, and matplotlib. If you’ve done the last few Labs you will already have them installed but if not, you need to install them now.
To do so, open a terminal window where you normally run your python commands and install the packages using pip:
pip install requests
pip install beautifulsoup4
pip install matplotlibImportantMake sure you have activated your virtual environment before attempting to install packages
This should install the libraries you need. You can test that they are installed correctly by opening up a python interpreter and running the following commands:
import requests
from bs4 import BeautifulSoup
import matplotlib.pyplot as plt
If any of those return errors, something didn’t work. If they just return the interpreter prompt, you are good to go. We won’t be using all of the library functionality and will just be importing parts of them in the project. We’ll give you the details at the appropriate time.
Task 2 - Create the initial program
For this project, you’ll be submitting several files. You’ll put your main program in a file named webcrawler.py but there will be others you create along the way as well.
Just like in Project 1, we’ll be passing command line arguments to this program to tell it which of the three tasks we want it to perform. The three commands this program should accept are:
-c <url> <output filename 1> <output filename 2>
-p <url> <output filename 1> <output filename 2>
-i <url> <output file prefix> <filter to run>
The -c command is for counting the links. The URL is the starting page of the
search. Output file 1 will contain the histogram image and output file 2 will
contain the raw data in CSV format.
The -p command is to extract and plot data. The URL is the page that contains
the data to extract. Output file 1 will contain the data plot and output file 2
will contain the data in CSV format.
The -i option is for finding and manipulating an image. The URL is the page
where we want to extract images. The output file prefix is a sting that will be
prepended to the name of every image manipulated to produce the name of the
output image file. The filter to run will be a flag specifying which filter from
your image manipulation program to run. Specifically, your program should handle
the following filter flags:
-s- sepia filter-g- grayscale filter-f- vertical flip-m- horizontal flip (mirror)
Some examples of possible commands are:
-c https://cs111.byu.edu/Projects/project04/assets/page1.html count_links.png count_links.csv
-p https://cs111.byu.edu/Projects/project04/assets/data.html data.png data.csv
-i https://cs111.byu.edu/Projects/project04/assets/images.html grey_ -g
-i https://cs111.byu.edu/Projects/project04/assets/images.html sepia_ -s
NoteThese are working examples, so you can tests with them if you would like, though individual pytests are also included below.
Write code to verify that the passed in parameters are valid and print an error message if they are not. Your error message should contain the phrase “invalid arguments” somewhere in the text returned to the user (this is what the autograder will be looking for).
Part 2 - Counting links
The part of the project will implement the -c command to count links. For this
operation, you’ll be given a starting URL that represents the home page of the
site to analyze, along with the name of two output files for storing the final
data.
An overview of the basic algorithm of this part of the code is as follows:
- Given the initial URL
- Use your
RequestGuardclass from Homework 6 to process the robots.txt file - Add the link to the list of links to visit
- Use your
- Get the next link from the list of links to visit
- If the link has been visited already, increment the count for that link
- If not
- Add it to a dictionary of visited links with a count of 1
- If you are allowed to follow the link (use
RequestGuardto check), load the page, and process then add all links on the page to your links to visit list
- Repeat step 2 until the list of links to visit is empty
- Create a plot from the dictionary of visited link counts and write it to output file 1
- Write the data from the dictionary of visited link counts in CSV formate to output file 2
Task 1 - Limiting where your program goes
This is step 1.1 from the algorithm above and uses the RequestGuard class you wrote in Homework 6.
Using the url passed in from the command line, create a RequestGuard object.
This object will read the website’s robots.txt file and set it up so you can
use the can_follow_link() and make_get_request() methods later on.
CRITICAL WARNINGIt is absolutely critical that your program respects the robots.txt file and limits its page loads to the initially specified domain. In addition to just being proper web etiquette, if your program wanders off the specified site and starts traversing the entire internet it could have negative repercussions for you, your fellow students, and the University. This has happened in the past and BYU has been blocked from accessing certain important websites. Please keep this in mind and don’t point your program at major websites. Limit it to small sites you control or the ones we give you to test with.
Task 2 - Data storage
There are a couple of data items your program will need. The first is a list of all the links you need to visit. Create that list and store the initial URL (passed in on the command line) in the list.
You will be iterating over this list, which will contain the links you need to visit. There are a few ways to implement this iteration:
- Keep track of the current item index and increment it to move through the list
- Create a generator to give you the next link each time it is called
- Remove each item after you visit it using list slicing
- Use a function to pop the next link off of the list each time
All of the above methods will work, so the choice of which to use is up to you.
The other data structure you will need is a dictionary to keep track of the number of times a link appeared on the pages of the website. This will initially be empty but you still need to create it.
Task 3 - The main loop
This is step 2 in the algorithm presented above. Using the method you decided on
in Task 2, loop over each link in your list of links to visit and process it
according to the algorithm described. You’ll use your RequestGuard to
determine if it is a link that should be loaded, keep track of the number of
times the link appears in the dictionary you created, and add any links found on
the loaded pages to the list of links to visit.
To load a page, use your make_get_request() function you wrote for
RequestGuard to get the link and the BeautifulSoup library to search through
it for <a> references. Your code may look something like this:
page = request_guard.make_get_request(link)
html = BeautifulSoup(page.text,"html.parser")
for tag in html.find_all('a'):
    href = tag.get('href')
    ## process the link
While processing links, there are a few different link formats you will come
across. You can handle them using the urljoin function we learned in
Lab 22. Then we want to treat all of the links with
fragements the same. That means we should just get rid of any fragments in what
urljoin returns.
HintYou might try using the
.split()function when removing fragments.
Pro TipPrint each link as you process it! Trust us, it will help a lot with debugging your code.
Once you have all that working, you’re ready to crawl the site and generate the link count data. To test your code, crawl the following webpage:
https://cs111.byu.edu/Projects/project04/assets/page1.html
The next step is to plot your data and save it to a file.
Task 4 - Generating the plot
Now that we have a list of links and the number of times they were referenced,
we need to generate the data for our plot and create the plot itself. For this
we will use matplotlib’s histogram functionality, the plt.hist() function to
create a bar chart showing the number of links that are referenced 1, 2, 3, 4,
etc. times. You should read the documentation for this function
here.
The data you need to pass to the function are the values in your dictionary
of link counts. You’ll need to specify the bins parameter when you call the
hist() function. This parameter defines the edges of the histogram bins. For
example if you had the following count data:
[1, 3, 6, 2, 1, 1, 4, 2, 3, 6, 2]the bins should be:
[1, 2, 3, 4, 5, 6, 7]You should save the generated histogram image to a file using the name which was
passed in on the command line (<output filename 1>).
The hist() function returns three items, the first two are lists containing
the counts in each bin and the values of the bin edges. You’ll need to capture
all three of them but will only use the first two.
Using those values, create a file with the name specified by
<output filename 2> which was passed in as a command line argument. Write your
data to that file as a comma separated value list with each line holding the bin
value followed by the counts in that bin. For example, give the data above,
hist() would return the following lists:
values = [3., 3., 2., 1., 0., 2.]
bins = [1., 2., 3., 4., 5., 6., 7.]
The resultant file would look like:
1.0,3.0
2.0,3.0
3.0,2.0
4.0,1.0
5.0,0.0
6.0,2.0
Note that the last bin value (7 in this case) is not printed to the file.
If you are successfully generating both files, you are done with this part of the project.
Test your code:
python3 -m pytest test_webcrawler.py::test_count_linksPart 3 - Reading and plotting data
In this part of the project, you’ll implement the functionality for the -p
command line argument. For this you’ll find a specific table on a specified web
page and read the data from the table, plot it, and save the data to a CSV file.
Task 1 - Load the page
The page to load is specified by the <url> parameter on the command line.
Load the page, printing an error and exiting if the page doesn’t exist. Once you’ve read the page, convert it into an object that you can search through.
Task 2 - Find the table and parse the data
You need to find a table with the the “CS111-Project4b” id on the specified page. Once you’ve found that you need to read the data from the table. The first column of the table will contain the x-values for the data, every subsequent column will contain a set of y-values for the x-value for the row. Each column should be read into a list of data.
HintOnce you’ve found the table, you can extract a list of table row (
<tr>) elements that will contain as its table data (<td>) values, the x-value in the first<td>element, and the y-values in all the others. Loop over the table rows, extracting the values (assume they are all floats) and store them in the data lists as numbers.
Task 3 - Plot the data and write the output.
For this part of the program, we’ll be using the plt.plot() function. You can
read the documentation on this function
here.
Each set of y-values should be plotted against the x-values and all the lines should be on a single plot. Each set of y-values should have a different color. The first y-value set should be blue, the second, green, then red, then black. We will never have more than four data sets on a page for you to plot.
Once you’ve created the plot save it to the file specified as <output file 1>
in the command line arguments.
After you’ve saved the plot, you should create the CSV file containing the data.
This will be saved in the file specified by <output file 2> in the command
line arguments. Each line should have the x-value, followed by each of the
y-values for that x-value, separated by commas. They should be presented in the
same order they appeared in the table on the web page.
Test your code:
python3 -m pytest test_webcrawler.py::test_plot_data_two_column
python3 -m pytest test_webcrawler.py::test_plot_data_four_column
Task 4 - Refactoring
Was any of the work you did in this part the same as you did in Part 2? Do you have code duplication? Do you have code that is similar that you could generalize? Maybe you already noticed some and did that as you were writing the code for this part of the project. Or maybe you didn’t. If you do have duplicate or similar code, consider refactoring your program to remove the duplications and create functions that can be called in multiple places.
HintLook at the code that writes the CSV files.
Part 4 - Modifying images
In this part of the project, you’ll be finding all the images on the page
specified by the <url> command line argument, downloading them, applying the
specified filters to them using the code you wrote in Project 1, and writing the
new images to disk.
Task 1 - Find the images
Images on a web page are specified by the <img> tag. The URL to the image is
in the src attribute in that tag. Just like the links in Part 2, the URLs in
the src attribute may be complete, absolute, or relative URLs that you will
need to construct the complete URL. This complete URL will allow you to download the image.
Load the web page specified by the <url> command line argument and create a
list of all the URLs to the images on that page. We’ll use that list in the next
task.
Task 2 - Download the images
For this part you’ll need the code you wrote in
Project 1. Copy your image_processing.py file into
your Project 4 directory. Add a line to webcrawler.py to import the
necessary functions from that file. You can either import just the ones you
need, import all of them if you don’t have name conflicts, or just import the
file as a package (so you’d call the functions as image_processing.grayscale()
for example).
Since we are going to use our byuimage library to process the image, we first
need to save all the images to the local disk so our Image object can open them
(it’s not designed to take a raw byte stream). To do this, we’ll take advantage
of the .content attribute that the response object has that just gives you the
raw data received. For each image URL we need to do the following:
response = request_guard.make_get_request(image_url, stream=True)
with open(output_filename, 'wb') as out_file:
    out_file.write(response.content)
This gets the image (url variable) and opens it before saving it directly to the
output_filename file. Be sure to include the correct file type at the end of
the filename.
Before you can run this code, you need to generate the output file name. You should just use the filename provided in the URL. So if the URL is “https://cs111.byu.edu/images/image1.png”, the output_filename should be “image1.png”.
Task 3 - Process and save the images
Now that the images are downloaded, you need to apply the filter to them and save the modified image with the new filename. You could do this in a separate loop or as part of the loop that downloads the images.
For each image you need to do the following:
- Create the output filename - this is just the original filename with the
<output file prefix>command line argument prepended to it. If the filename was “image1.png”, and the<output file prefix>was “g_”, the output filename would be “g_image1.png”. - Call the appropriate filter function based on the
<filter to run>command line argument, passing in the necessary arguments. - Save the modified image to the output filename determined in step 1.
Test your code:
python3 -m pytest test_webcrawler.py::test_modify_images_sepia
python3 -m pytest test_webcrawler.py::test_modify_images_grayscale
python3 -m pytest test_webcrawler.py::test_modify_images_vertical_flip
python3 -m pytest test_webcrawler.py::test_modify_images_horizontal_flip
Task 4 - Refactor
Once again, look at your code for any duplicate or similar code and consider creating functions to simplify the code, make it more clear, and/or reduce redundancy.
Turn in your work
Congratulations, you’ve completed the project.
Test your code:
python3 -m pytestYou’ll submit your webcrawler.py, RequestGuard.py, and image_processing.py files on Canvas via Gradescope where it will be checked via the auto grader. We will be testing your program using both the website and examples we gave you to test with as well as other pages. Make sure that you haven’t “hard coded” anything specific to the test data. We do not guarantee that all scenarios are tested by the sample data that we have provided you. The auto grader for this project will not test specific functions so you are free to name your functions whatever you want.
Going further
- We only included image filters that required no additional input parameters. How would you extend this program to also be able to use filters that did take additional parameters?
- You can think of a website as a tree with the homepage as the root node, all the link from that page as depth 2, the links from the depth 2 pages as depth 3, etc. What if you only wanted to crawl a website to a given “depth”? How might you implement that functionality, something common in real web crawlers?